
Knowing an item’s real price history takes the guesswork out of any Amazon purchase. CamelCamelCamel is a free tool that shows an Amazon product’s price history as a chart and lets you set an email alert for when it drops to a target price. Install the browser extension or visit the site directly, search for or paste in the Amazon product link, review the chart to see how the current price compares to its history, and set an alert if it isn’t at your target yet.
It’s Amazon-only — it won’t help with other retailers — but for Amazon-heavy shopping, its free price history and alert system covers the two things that matter most: knowing if a “deal” is real, and getting notified without checking manually every day. Set it up once and let it do the watching for you.
As an Amazon Associate we earn from qualifying purchases at no extra cost to you. Product prices and availability are accurate as of the date shown and are subject to change.


Top 3 picks at a glance
Quick answer
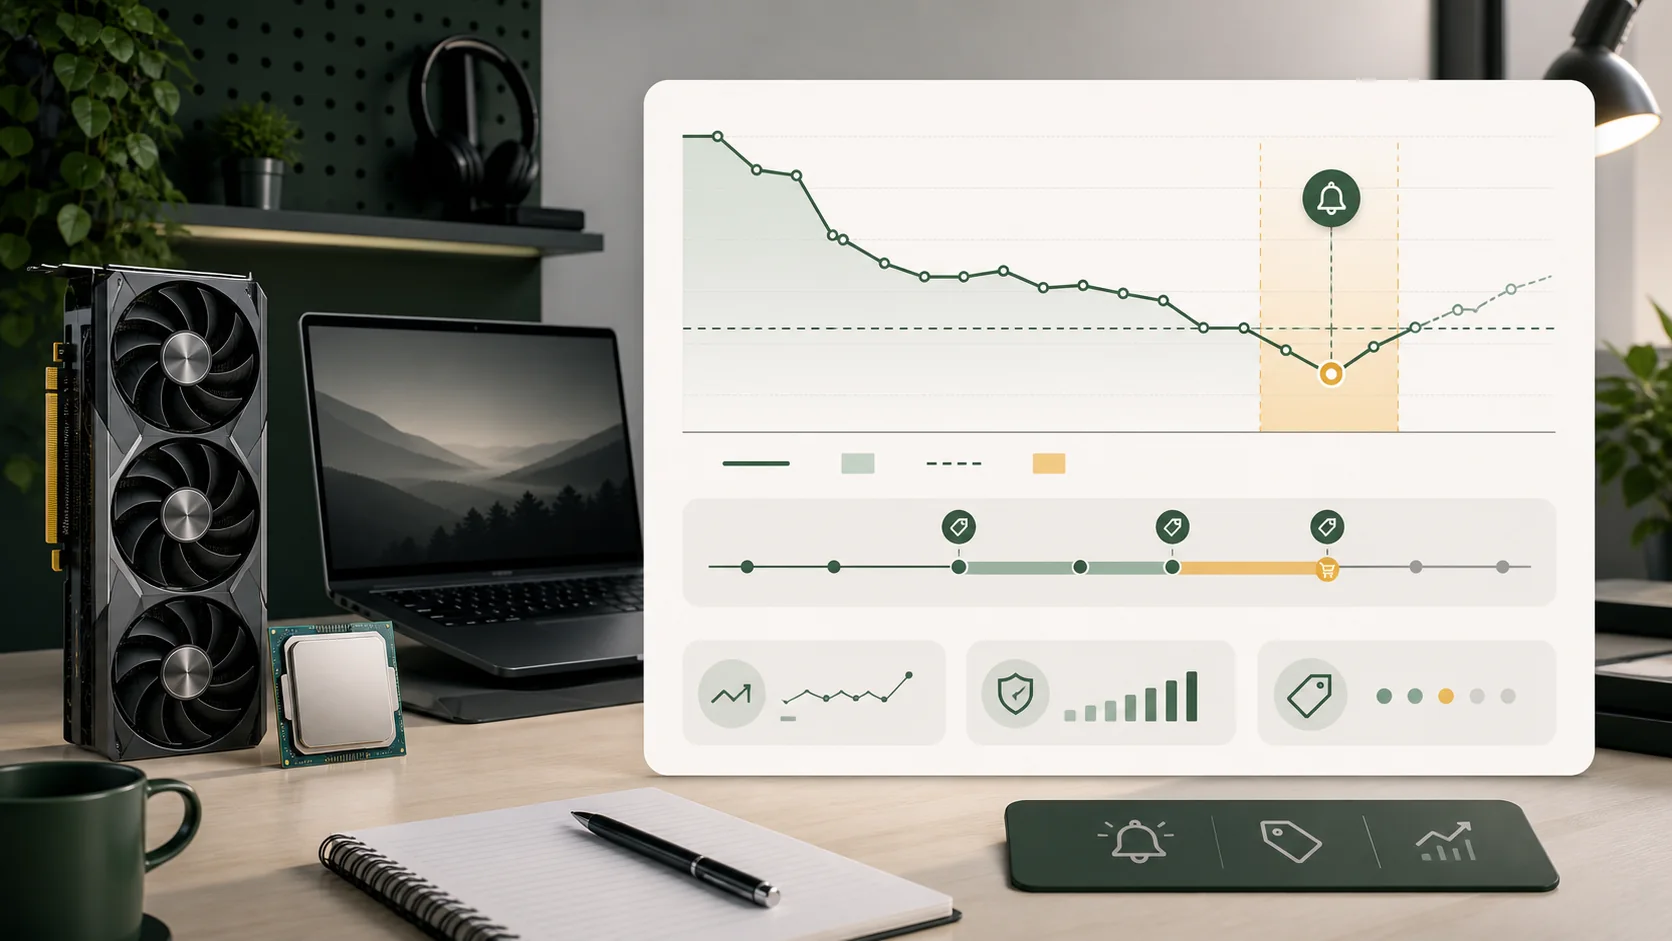
Search or paste an Amazon product link into CamelCamelCamel, review its price history chart to judge whether the current price is genuinely low, and click the option to set a price-drop alert with your target price and email. The browser extension adds this same chart directly onto Amazon product pages as you browse, without needing to visit CamelCamelCamel’s site separately each time.
| Feature | Free? | What it does |
|---|---|---|
| Price history chart | Yes | Shows price trend over time for a listing |
| Price-drop email alert | Yes | Notifies you when price hits your target |
| Browser extension overlay | Yes | Shows chart directly on Amazon product pages |
Reading the price history chart
The chart plots the listing’s price over time, typically showing separate lines for the Amazon-sold price and, where relevant, the third-party seller Buy Box price if multiple sellers compete for the same listing. Look at the overall range — the highest and lowest points the price has hit historically — rather than just the most recent few weeks, since a short recent window can make a modest, unremarkable dip look more significant than it is in the full context.
A genuinely good deal typically shows the current price at or very near the chart’s historical low point, not just below a recent temporary spike. If a listing shows the price jumping up right before a “sale,” then dropping back to roughly where it was before the spike, that’s a common pattern worth being skeptical of — the discount is measured against an artificially inflated recent price rather than the item’s normal selling range.
Hovering over specific points on the chart usually shows the exact price and date, useful for pinpointing exactly when a past low occurred and how long it lasted, which helps set a realistic target price for your own alert.
It’s worth developing a habit of checking three specific reference points on the chart rather than just glancing at the overall shape: the all-time low, the average price over roughly the last six months, and the price immediately before whatever “sale” is currently being advertised. If the current price is close to the all-time low, it’s a strong deal regardless of the advertised discount percentage. If it’s close to the six-month average but far from the all-time low, it’s an unremarkable price dressed up as a sale. And if the pre-sale price shown right before the current markdown is itself unusually high compared to the rest of the chart, that’s the inflated-comparison pattern worth flagging specifically.
Reading multiple sellers on the same listing
Many popular PC parts are sold by more than one seller under the same Amazon product page, with Amazon itself sometimes competing alongside third-party marketplace sellers for the same Buy Box. CamelCamelCamel’s chart typically separates these two price lines, and it’s worth checking both rather than assuming the number shown is the only price in play — a third-party seller occasionally undercuts Amazon’s own price temporarily, and the chart line for that seller can look meaningfully different from the Amazon-sold line over the same period.
This distinction matters most for components that go in and out of stock frequently, since Amazon’s own stock sometimes runs out while a third-party seller still has inventory, at a different price point. A price history chart that only shows one of the two lines can make a current listing look more or less competitive than it actually is, depending on which seller you’d actually be buying from at checkout.
Installing and using the browser extension
The CamelCamelCamel browser extension adds a small price-history graph directly onto Amazon product pages as you browse normally, without needing to copy links into a separate site. Install it from your browser’s extension store, and it activates automatically whenever you visit a supported Amazon product page.
This is the more convenient method for casual browsing, since you see the price context immediately while shopping rather than needing to remember to check a second tool. The extension typically also includes a quick button to set a price-drop alert directly from the product page, without a separate step.
Review what permissions the extension requests during installation — like most price-tracking extensions, it needs to read Amazon page content to overlay the chart, which is a broad-sounding permission that’s standard for this category of tool but still worth understanding before installing.
Setting a price-drop alert
From either the CamelCamelCamel website or the browser extension overlay, look for the option to set a price watch, enter your target price based on what the history chart shows as a realistic low, and provide your email if you’re using the site directly (an account isn’t always required for basic alerts, but check the current signup flow, since it can change).
Set a realistic target based on the chart’s actual historical low rather than an arbitrarily optimistic number that the item has never actually reached — an alert set below any point in the item’s price history may simply never trigger, leaving you waiting indefinitely for a price that isn’t likely to occur.
You can typically manage multiple active price watches at once, useful if you’re tracking several components for a planned build simultaneously and want to be notified as each one hits its own target independently.
A useful target-setting strategy for components you’re not in a rush to buy: rather than setting the target exactly at the historical all-time low (which may take many months or never happen again), set it slightly above the all-time low but clearly below the recent average price. This captures the majority of the realistic savings while triggering more often than an alert pinned to an exact historical record, which is a meaningful practical tradeoff if you actually want to complete a purchase within a reasonable timeframe rather than waiting indefinitely for a once-a-year event.
What the price history chart can’t show you
Temporary discount codes, subscribe-and-save pricing, and some third-party seller promotions don’t always show up cleanly in the standard price history chart, since it’s primarily tracking the visible listed price rather than every possible discount mechanism layered on top. If a listing looks expensive on the chart but you know a coupon is currently active, check the actual checkout price directly rather than relying solely on the chart.
The chart also can’t tell you about stock availability history — a price staying flat for months could mean steady stock, or it could mean the item has been out of stock and the listed price is essentially inactive during parts of that period. Cross-check current availability directly on the Amazon listing.
Shipping cost is another factor the core price chart doesn’t always fold in cleanly. A listing that looks like the absolute cheapest option on the chart can end up costing more at checkout once a separate shipping fee, or a lack of eligibility for free shipping thresholds, is added — particularly relevant for heavier components like PSUs or full prebuilt towers where shipping costs scale with weight. Always let the final checkout total, not the product page’s headline price, be the number you compare against your target.
Tax treatment can vary by state or region in ways the chart doesn’t reflect either, since CamelCamelCamel tracks the listed product price rather than a fully calculated checkout total specific to your location. Two shoppers in different regions can see the identical chart and identical listed price, yet end up paying meaningfully different final totals once tax is applied — worth factoring in in particular when comparing a tracked Amazon price against a competing retailer’s advertised price that might handle tax differently at checkout.
It’s also worth remembering that CamelCamelCamel’s chart reflects the retail price history for that specific listing, not a running record of every promotional code or membership-specific discount that might have applied to other shoppers at different points. Someone with an active membership program’s benefit, or a targeted personal promo code from a previous order, may have paid less than the chart’s lowest recorded line at some point without that lower price ever showing up in the public historical data.
Using CamelCamelCamel effectively
- Install the browser extension, or go to the CamelCamelCamel website directly.
- Search for your product, or paste the Amazon product URL if using the website.
- Review the price history chart’s full range, not just the recent weeks.
- Identify a realistic target price based on past historical lows.
- Set a price-drop alert at that target price with your email.
- Check the actual Amazon checkout price for active coupons or promotions the chart might not fully reflect.
- Repeat for each product you’re tracking, managing multiple alerts from your account if needed.
When CamelCamelCamel isn’t the right tool
If you’re comparing prices across multiple retailers rather than tracking a single Amazon listing over time, CamelCamelCamel doesn’t help — it has no visibility into other retailers at all. PCPartPicker or manually checking a handful of retailer sites directly fills that specific gap.
Very new product listings won’t have meaningful price history yet, since the chart depends on accumulated data over time — a product that launched last week simply won’t show a useful historical range regardless of how the tool is used.
International or region-specific Amazon marketplaces outside CamelCamelCamel’s main supported regions may have limited or no coverage, so check that your specific Amazon storefront is supported before relying on it for a non-US or non-primary marketplace purchase.
Reviewing your active alerts periodically
An alert set months ago for a component you were considering can quietly become irrelevant as your plans change, or as a newer product generation makes the original target less meaningful — checking your CamelCamelCamel account’s full list of active watches every so often, rather than only interacting with it when a new notification arrives, helps you clear out alerts that no longer serve a purpose and refocus on the ones that still matter for a purchase you’re actually planning to make soon.
This periodic review is also a good moment to confirm your notification email is still current and that alerts haven’t silently stopped working due to an account or browser extension issue, since the only way to know for certain an alert is still functioning is to check its status directly rather than assume silence simply means the price hasn’t dropped.
Troubleshooting
Symptom: No price history chart appears for a product. Cause: the product may be too new, or it’s a variant/bundle listing tracked separately from the main product’s history. Fix: search for the base product directly on CamelCamelCamel rather than relying on the extension picking up a specific bundled listing automatically.
Symptom: Alert never triggers despite the price visibly dropping on Amazon. Cause: the price drop may apply to a different seller or listing variant than the one tracked by your alert. Fix: confirm you set the alert on the exact same listing (same seller, same variant) currently showing the lower price.
Symptom: Browser extension doesn’t load the chart on some Amazon pages. Cause: certain page types (search results, some third-party marketplace pages) aren’t supported by the overlay. Fix: navigate to the specific individual product page directly, where the extension is more reliably supported.
Symptom: The chart looks like a great deal, but the actual checkout price is noticeably higher. Cause: the chart tracks the standard listed price and doesn’t always account for shipping costs, tax, or a specific seller’s markup if you’re not buying from the primary Amazon-sold listing. Fix: always confirm the exact final checkout total before purchasing, treating the chart as a pricing signal rather than a guaranteed final cost.
A note on how CamelCamelCamel is funded
CamelCamelCamel earns a commission on qualifying purchases made through its links, which is worth understanding as its funding model rather than a hidden catch — the price you pay on Amazon is the same regardless of whether you arrived via the extension, the site directly, or a plain Amazon search, since Amazon sets one public price rather than a special rate for affiliate traffic.
Frequently asked questions
Is CamelCamelCamel completely free to use?
Yes, its core features — price history charts, price-drop email alerts, and the browser extension — are free with no paid tier required for normal personal use.
Does CamelCamelCamel track prices on retailers other than Amazon?
No, it’s built specifically for Amazon listings and doesn’t track other retailers at all. For cross-retailer comparison, a tool like PCPartPicker is the better fit alongside CamelCamelCamel.
How accurate is the price history chart?
It’s generally accurate for tracking Amazon’s own listed price over time, since it pulls directly from Amazon’s pricing data, but it can’t account for temporary coupon codes, subscribe-and-save discounts, or third-party seller pricing on the same listing.
Why didn’t I get an alert even though the price dropped below my target?
This usually happens when the price drop applied to a different seller or variant of the listing than the one your alert was set on, or when the drop was extremely brief and CamelCamelCamel’s update cycle didn’t catch it before it reverted.
Can I track multiple products at once with CamelCamelCamel?
Yes, you can set alerts on as many individual product listings as you want, and a free account lets you manage and view all your active watches in one place on the site.
Rachel Osei cross-referenced CamelCamelCamel’s historical charts against her own price-history database covering multiple retailers and years of sale cycles to confirm the tool’s accuracy for common PC parts. For related tools, see how to price track gaming hardware and how GPU pricing works. If you want to stack a genuine price drop with an additional discount, how to stack coupons and cashback is a useful next step.


