
Price tracking gaming hardware means monitoring a specific SKU’s cost over time through a dedicated tool or browser extension, then setting an alert for your target price instead of manually rechecking listings. Done correctly, it turns a vague “watch for a deal” habit into a system that notifies you the moment a real drop happens, typically catching swings of 15% or more that manual browsing misses.
Top 3 picks at a glance
Why manual checking loses to tracking
Checking a listing’s price by memory or by revisiting it every few days misses most short-lived drops, since flash promotions and marketplace price changes can happen and reverse within hours, long before a typical weekly browsing habit would catch them.
As an Amazon Associate we earn from qualifying purchases at no extra cost to you. Product prices and availability are accurate as of the date shown and are subject to change.


Memory is also unreliable for judging whether a price is actually good. Shoppers routinely misremember a component’s price from a few weeks earlier, which makes an unaided “that seems cheap” judgment call far less accurate than a chart showing the actual 90-day range.
Manual checking scales poorly across multiple retailers. Comparing the same GPU model across three or four stores by hand, repeated weekly, consumes real time that a single tracking dashboard consolidates into one view updated automatically in the background.
Automated tracking also removes the emotional bias that comes from actively wanting to buy something. When you’re the one manually checking a listing you want, it’s easy to convince yourself a modest discount is “good enough” rather than waiting for the data to confirm it.
The time cost difference is significant at scale: tracking five components manually might take 20-30 minutes weekly, while setting up automated alerts for the same five items takes about 10 minutes total, one time, with zero ongoing manual effort afterward.
None of this means manual checking is useless, particularly for a single upcoming purchase in the next few days. But for anyone tracking multiple components over weeks or months, an automated system consistently outperforms memory and habit.
Price-tracking tools worth setting up
Browser extensions that overlay historical pricing directly onto product pages are the most convenient starting point, since they require no extra steps beyond installing them once and browsing normally afterward, with the chart appearing automatically on supported retailer pages.
Standalone tracking websites, searched separately from the retailer, often carry a longer historical window (12+ months versus 90 days for some extensions) and support price-drop email alerts without needing the extension installed on every device you browse from.
Some tracking tools specialize in specific retailers or marketplaces, offering deeper historical data and more accurate alerts for that platform specifically, compared to general-purpose tools that aggregate across many retailers with less depth per store.
Spreadsheet-based manual tracking remains a valid option for a small number of high-value items, particularly for shoppers who want full control over what data is logged, though it requires discipline to update consistently and lacks automated alerting.
Combining an extension for quick in-page checks with a standalone site for setting longer-term alerts covers most tracking needs without requiring a paid subscription, since the core price-history and alert features are free on the majority of popular tools.
Whichever tool you choose, confirm it’s tracking the exact SKU or model number rather than a general product category, since mismatched tracking is the most common reason an alert never fires even after a real price drop occurs.
Reading a price history chart correctly
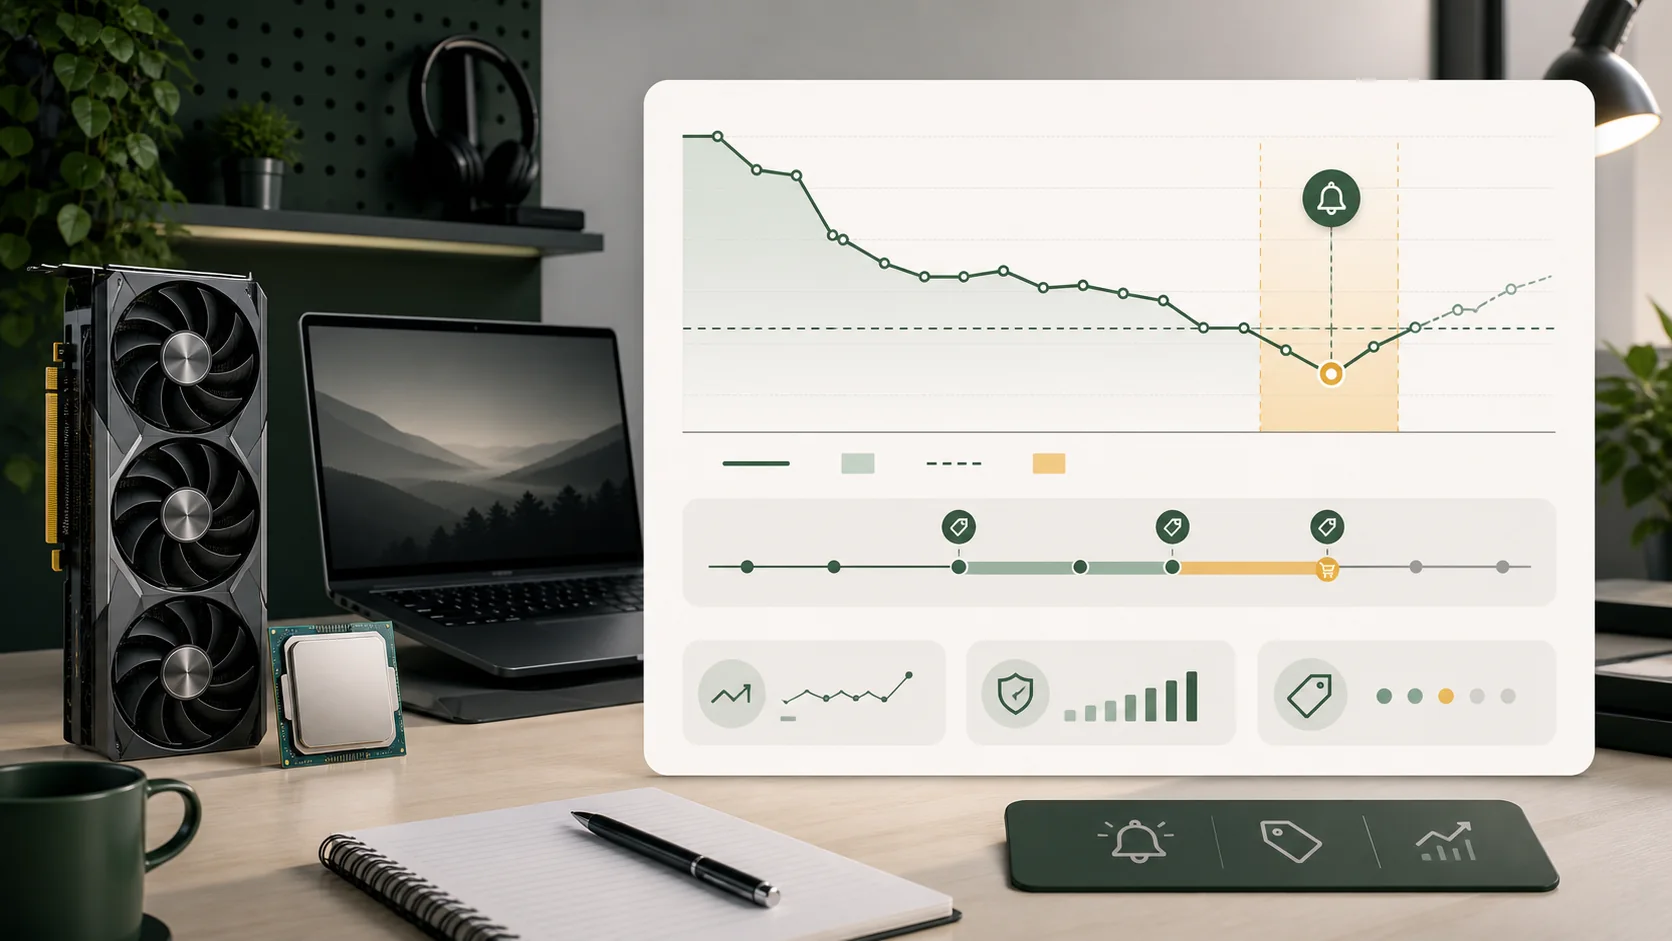
A price history chart plots the tracked price of a specific SKU across a set time window, usually 90 days to a full year depending on the tool, with the lowest and highest points clearly marked or easy to identify visually along the line.
The most useful reference point is the historical low, not the average. A component sitting at or within a few dollars of its charted low over the past 6-12 months represents genuinely strong value, regardless of what percentage discount badge the retailer displays.
Look for how frequently the price returns to its low point. Some SKUs dip to their low only once or twice a year during major sale events, while others fluctuate near their low every few weeks, which changes how urgently you should act when a drop occurs.
Flat, unchanging lines for extended periods usually indicate the tool isn’t capturing real price movement for that SKU, either due to limited retailer coverage or infrequent data refresh, which is a sign to cross-check with a second tool before trusting the chart.
Sudden brief spikes followed by a return to baseline often reflect temporary stockouts, where a retailer or reseller raises price during limited availability rather than a genuine value change, and shouldn’t be mistaken for the item’s “normal” price going forward.
Compare the chart across two or three retailers carrying the same SKU when possible. A component that looks like a rare deal on one retailer’s chart sometimes turns out to be a stable, ordinary price on a competitor’s listing for the identical part.
Setting alerts that actually fire in time
Set your target price based on the SKU’s actual historical low from the chart, not an arbitrary number, and set it slightly above that low (2-5%) rather than exactly at it, since alerts triggered right at a rare all-time low can be too narrow to ever fire.
Choose email or push notification alerts over any tool that only shows updated pricing on your next visit to the tracking site itself, since passive tracking without active notification defeats the purpose of setting an alert in the first place.
For high-demand items likely to sell out fast during a drop (limited-stock GPUs, popular prebuilt configurations), enable the fastest notification method available and consider having the purchase page pre-loaded in another tab once an alert fires, since stock can disappear within minutes.
Review and adjust alerts periodically, especially after a generational hardware change or a broader market shift, since a target price set six months ago may no longer reflect current realistic pricing for a component that’s since become more or less in demand.
Set multiple tiered alerts for a single item when the tool supports it: one at a “good enough” price you’d be satisfied with, and a second, lower one at the item’s true historical low, giving you flexibility depending on how urgently you need the hardware.
Test a new alert setup with a low-stakes, inexpensive item first to confirm notifications are actually reaching you reliably before relying on the same system for a higher-cost purchase like a full prebuilt tower or a current-generation GPU.
Typical price swings by component type
Different hardware categories fluctuate at different rates and depths over a typical year, which affects how tightly you should set a tracking target and how long you should expect to wait for a meaningful drop to occur.
| Component | Typical annual swing | Best tracking window |
|---|---|---|
| Graphics cards | 15-30% | 90+ days (captures generational clearance) |
| Prebuilt towers | 10-20% | 60-90 days |
| SSDs | 20-35% | 90+ days (volatile, frequent drops) |
| RAM kits | 15-25% | 60-90 days |
| Gaming monitors | 15-30% | 90+ days (event-driven) |
SSDs and RAM show the most frequent short-term volatility of the categories tracked here, meaning shorter tracking windows can still catch a worthwhile drop. GPUs and monitors reward patience over a longer window since their steepest cuts cluster around specific events rather than happening continuously.
These swing ranges also explain why a flat percentage rule (like “only buy at 20% off”) doesn’t work evenly across categories; applying our fake deal detection guide alongside this table helps confirm whether a specific swing is a real, trackable pattern or an inflated one-off badge.
Tracking more than one retailer
The same SKU frequently carries different pricing across retailers at the same moment, sometimes by 5-10%, which means tracking a single store’s price history can miss a better deal happening simultaneously elsewhere on an identical part.
Multi-retailer tracking tools that aggregate several stores into one dashboard are the most efficient way to handle this without manually maintaining separate tracking setups for each retailer you shop from regularly.
Pay attention to shipping and tax differences between retailers when comparing tracked prices, since a nominally lower sticker price at one store can end up costing more once shipping fees are added, particularly for heavy items like prebuilt towers.
Marketplace platforms with multiple third-party sellers require tracking the specific seller alongside the price, since the lowest tracked price on a listing page sometimes belongs to a seller with worse return terms or slower shipping than the primary listing.
Retailer-specific loyalty pricing, member-only discounts, or cashback programs can also shift the effective price below what a public tracking tool shows, which is worth factoring in manually once a tracked alert notifies you of a promising base price.
Building a habit of checking at least two retailers before finalizing any purchase over $200, even after an alert fires, typically confirms whether the triggering price is genuinely the best available option or simply the best price at that one specific store.
Historical low vs today’s “deal” claim
A retailer’s advertised “deal” price and a SKU’s actual historical low are frequently two different numbers, and confusing them is one of the most common mistakes shoppers make even after adopting a price-tracking habit.
Always compare today’s advertised price directly against the charted historical low rather than against the retailer’s own “was” price, since the “was” price can be set arbitrarily high regardless of what the item actually sold for previously.
A price sitting 10% below the historical average but still 8% above the historical low is a moderate deal, not an exceptional one, even if the retailer’s badge claims a large percentage off some inflated reference number.
When today’s price matches or beats the historical low shown in your tracking tool, that’s the strongest signal available that a purchase decision made now is unlikely to be beaten by waiting further, barring an unusual event like a surprise clearance.
Some tools display a “price rating” (like “good,” “great,” or “best ever”) calculated automatically from the historical data, which is a useful shortcut once you understand the underlying logic, though it’s still worth glancing at the raw chart for confirmation.
If a tool shows conflicting information (a “great deal” rating on a price that’s clearly above the visible historical low on the same chart), trust the raw historical-low comparison over the tool’s automated rating label.
Mistakes that waste a tracking setup
Tracking a general product name instead of an exact SKU or model number is the single most common mistake, since prices and even hardware specs can vary between near-identical listings, making the tracked history meaningless for the specific item you intend to buy.
Setting an alert threshold too close to the current price, rather than based on the actual historical low, results in alerts firing constantly for trivial fluctuations, which trains you to ignore notifications entirely by the time a genuinely good drop occurs.
Forgetting to update or remove alerts for items you’re no longer interested in clutters notification inboxes and makes it harder to notice the alerts that actually matter, particularly for shoppers tracking five or more components simultaneously.
Relying on a single tracking tool without cross-checking, especially for high-value purchases like a full prebuilt tower, risks missing a real deal that tool simply doesn’t have indexed, since coverage varies meaningfully between different tracking services.
Ignoring shipping costs, taxes, and retailer-specific fees when comparing a tracked “low” price against a purchase decision can turn an apparent good deal into a break-even or worse outcome once the full checkout total is calculated.
Acting on an alert without a final sanity check against the fake-deal red flags covered elsewhere on this site occasionally leads to buying from a listing where the tracked price drop was accompanied by a downgrade in seller reliability or return terms.
A simple weekly tracking routine
Set aside 10-15 minutes on a consistent day, ideally toward the end of the week when many retailers refresh weekend promotional pricing, to review any alerts that fired and scan tracked items that haven’t yet hit target.
Prioritize checking high-value tracked items (prebuilt towers, GPUs) first each week, since these carry the largest dollar impact from timing, before moving on to lower-cost accessories where the savings from waiting matter comparatively less.
Cross-reference any newly triggered alert against the current seasonal calendar covered in our timing guide; an alert firing in early November, just before Black Friday, might be worth holding off on briefly in case the seasonal event beats it.
Log or note any purchase decisions made, including the price paid and the source, to build your own reference data over time. This personal record becomes useful for judging future deals on similar hardware even faster than relying solely on external tools.
Revisit your full list of tracked items monthly rather than weekly, removing anything no longer relevant and adding new components as build plans or upgrade needs change, keeping the tracking list itself useful rather than cluttered.
Rachel Osei, Deals Editor, follows a comparable weekly review process using a price-history database covering multiple retailers and years of sale cycles, applying the same historical-low comparison method to every deal featured on this site before publication.
Related guides
- Warranty Considerations When Buying On Sale
- When Is The Best Time To Buy A Gaming Pc
- Seasonal Sale Calendar For Pc Gamers
Frequently asked questions
What’s the best free way to track gaming PC prices?
Browser extensions that overlay price history directly on product pages are the most convenient free option, since they require no separate site visits. Standalone tracking websites work equally well and often cover a longer history window, useful for confirming a SKU’s true historical low before setting an alert.
How often should I check tracked prices?
With alerts set up correctly, you don’t need to check manually at all; the tool notifies you when a target is hit. Without alerts, a weekly check on a Friday or Saturday, aligned with when many retailers refresh promotional pricing, is enough to catch most meaningful drops.
Can price tracking tools miss a real deal?
Yes, particularly for marketplace listings from third-party sellers who aren’t indexed by every tracking service, and for very short flash sales that end before the tool’s next data refresh. Cross-checking a high-value purchase across two different tracking tools reduces this risk.
Is tracking worth it for cheaper components like RAM or SSDs?
It’s worth it when buying in the $60-150 range, where a 20% swing still saves a meaningful amount, but for very low-cost accessories under $30, the time spent tracking often isn’t worth the few dollars saved compared to buying during a known seasonal window.
Do price-tracking tools work for prebuilt gaming PCs?
Yes, as long as you track the exact SKU or model number rather than a general product name, since prebuilt configurations change frequently. Some tools handle bundled or configurable prebuilt listings less reliably than single-component listings, so double-check the tracked spec matches what you intend to buy.


